Where are the seeds?
Horizon
|
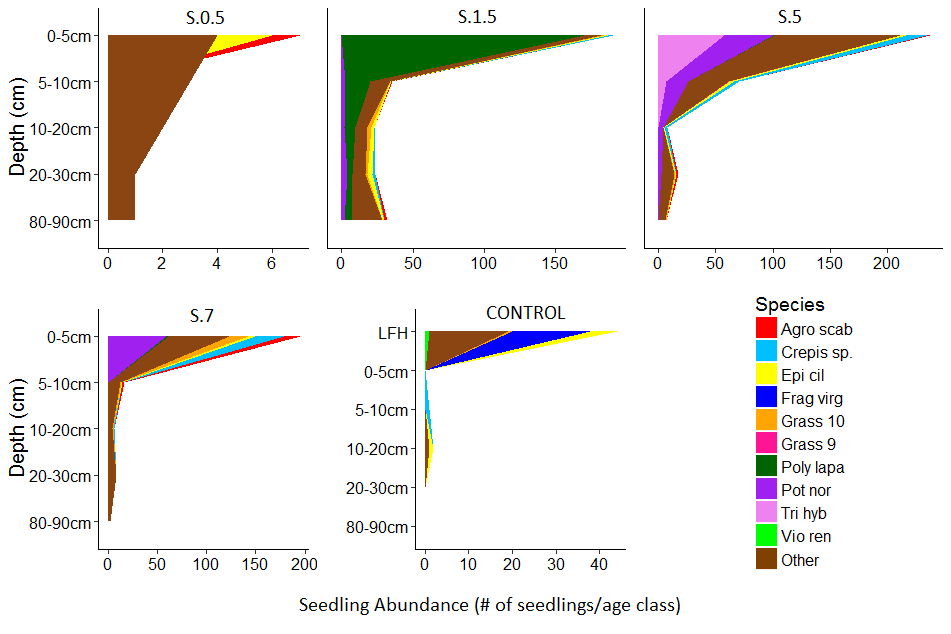
Fig 13. Stacked area chart showing seedling abundance by age class for the Horizon Site. Sites were combined based on the results from Figure 9. Colour represent species, with species codes being created using the first 3 letters of the genus and species. S represents stockpile site with age, and control is the natural forest community seed banks.
|
Most of the seeds that germinated from the stockpile sites germinated from 0-5 cm, and for the natural sites from the LFH layer (Table 1).
For the 1.5 year old stockpile, Crepis sp. and Agrostis scabra did not germinate on the surface, but were present at lower depths. This could indicate that these species are either present from before stockpiling, or that they moved down the soil profile over time. The abundance of non-native species increased with stockpile age (Crepis sp. and Trifolium hybridum).
Figure 13 and 14 were separated by sampling region because the stockpile seedling abundance was higher for Horizon (p=0.008). However, this separation was not done in the pairwise comparisons for depth because the seedling abundances were comparable for the natural forest sites at Horizon and Wolf Lake (p=0.249) and the pairwise results for stockpiles were the same for both sites.
Wolf Lake
|
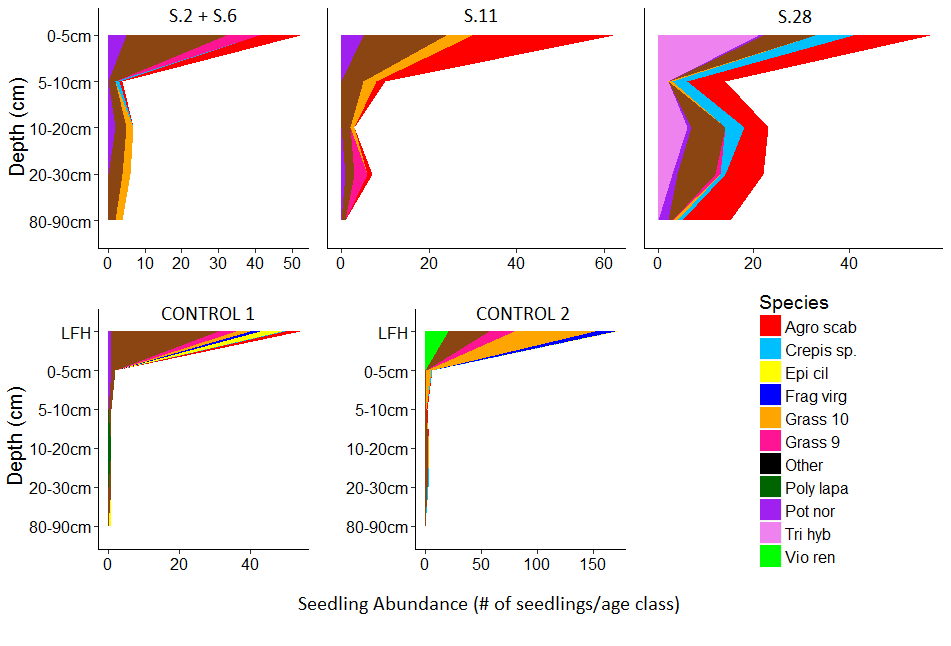
Fig 14. Stacked area chart showing seedling abundance by age class for the Wolf Lake Site. Sites were combined based on the results from Figure 9. Colours represent species, with species codes being created using the first 3 letters of the genus and species. S represents stockpile site with age, and controls are for natural forest community seed banks.
|
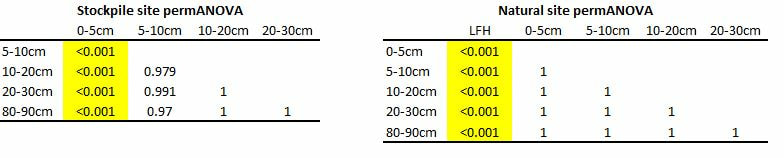
Wolf Lake showed similar patterns, with the LFH and 0-5cm depths showing more seedlings germinating than at the lower depths in natural forest and stockpile sites respectively (Table 1). Grass 10 and Grass 9 were seen below the surface at the 2/6 year old age class and 11 year old stockpiles respectively. Again, this could indicate a movement of species down the soil profile or species that are able to remain viable when stockpiled. The oldest stockpile (28 years old) had the most seedlings germinating from below 0-5 cm. It is more likely that these species are present due to a movement down the soil profile with time, as 28 years is a long time for seeds to remain viable. This is further supported by the fact that the same species are also found at the surface depth. The abundance of non-native species also appears to increase with age at Wolf Lake (Crepis sp. and Trifolium hybridum).
Are stockpile communities becoming more similar to natural forest communities over time?
Above ground
|
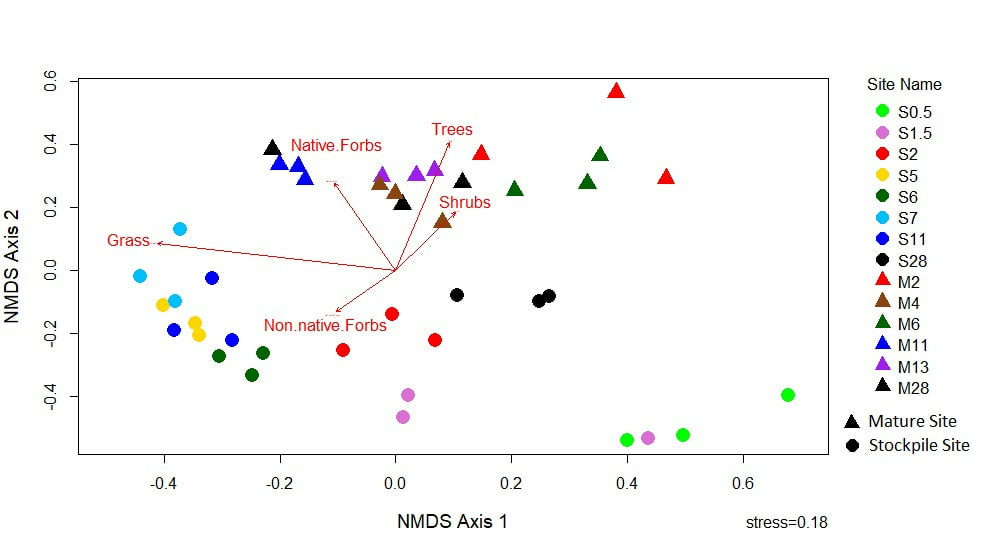
Fig 15. 2D NMDS of above ground plant community functional group cover. Colour represents site name. Triangles represent natural forest sites and circles stockpile sites. Vectors show the influence of functional group cover. Variance explained by 2 axes is 63%.
|
The 2D NMDS based on functional group covers seems to suggest that what is separating the above ground natural forest communities from the stockpile communities (p=0.001) is tree, shrub and native forb cover, which is to be expected of a closed canopy forest site (Fig 15). Stockpile communities had more grass and non-native forb cover. These are undesirable functional groups for reclamation and could be out competing the desirable functional groups (native forbs, shrubs, and trees) and preventing them from establishing on the surface of the stockpiles. Older stockpiles did not appear to be more similar to natural forest communities.
There was a significant difference (p=0.014) between functional group communities for Wolf Lake and Horizon, however, when plotted these communities do not appear to separate out based on sampling region, so they were plotted together. Also, when plotted separately the same trend emerges. The same procedure was followed for region in the seed bank communities (MANOVA region p=0.038).
There was a significant difference (p=0.014) between functional group communities for Wolf Lake and Horizon, however, when plotted these communities do not appear to separate out based on sampling region, so they were plotted together. Also, when plotted separately the same trend emerges. The same procedure was followed for region in the seed bank communities (MANOVA region p=0.038).
Seed bank

|
Fig 16. 2D NMDS of the surface seed bank community functional groups. Total variance explained by the 2 axes was 27 %. Colours represent site name and stockpile age. Stockpile sites are represented by circles and natural forest sites by triangles. Vectors show influence of functional group cover.
|
The 2D NMDS on seed bank functional groups still shows a difference between the stockpile and natural forest communities (p=0.021) (Fig 16). However, tree and shrub cover appear to have less of an influence on the natural forest site community as seen by the shorter vectors. Many tree and shrub species mainly reproduce vegetatively and not by seed, which explains why they are not abundant in the seed bank. Also, the younger 1.5 year old stockpile has more non-native forbs than the other seed bank communities. Overall, the older stockpile seed bank communities do not appear to be more similar to our natural forest communities.
Above ground a good indicator of the seed bank community?

|
Fig 17. 2D NMDS of the above ground community data. Colours represent site name and stockpile age. Stockpile sites are represented by circles and natural forest sites by triangles. Red vectors represent influence of below ground (seed bank) count proportions and green vectors for above ground cover. Vectors include 5 most abundant above ground species and the 5 most abundant seed bank species. All 10 are included in both sets of vectors.
|
The majority of above ground and seed bank species vectors are pointing in the same direction, indicating that the same species are abundant both above and below ground for the same sites (Fig 17). However, this is not true for trees, which are abundant in the natural forest above ground communities, but not in the seed bank. This is because these tree species typically reproduce through rhizomes, not by seed. In general the above ground plant community is a good indicator of the seed bank community for forbs and grasses, but not for trees.

Management Implications
Are these the plant communities we are looking for? We can now confirm that most viable seeds were present in the top few centimeters of the soil profile in these stockpiles. In the future, when salvaging soil from either a stockpile or natural forest site, companies should consider only taking soil from the first few centimeters to prevent dilution of the seed bank. Also, when using older stockpiles as a reclamation material more weed management may be necessary.
Older stockpile plant communities do not look more like natural forest communities due to a lack of trees and shrubs. In the future, management of new reclamation sites should focus on planting these species. However, planting them directly onto a stockpile may be a waste, since they do not appear to be retained in the seed bank.
Our above ground plant communities were only a good indicator of the seed bank in the case of grasses and forbs, which is a good start. Now we will be able to see if any planting of native forbs or grasses is needed, or if more weed management will be required.
