Count Data: It's normal not to be normal!
|
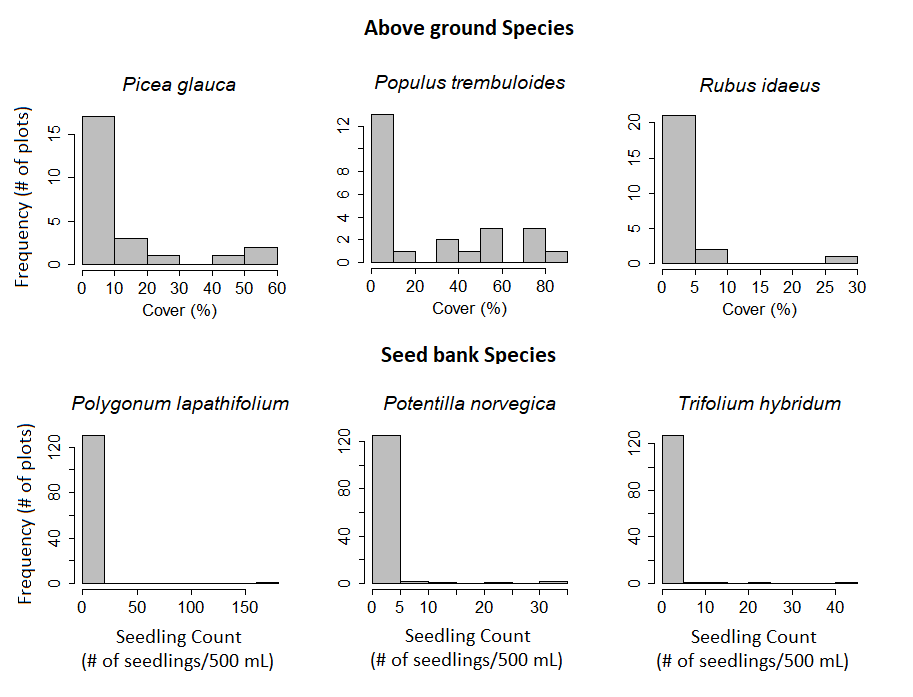
Fig 7. Histograms for above ground and seed bank species showing their distribution. Plotting cover for above ground and seedling count for seed bank species.
|
Count data and cover data are typically not normal, as it is common to have many plots with no observations for a given species. Data was explored using histograms to confirm the distribution of the data and check for any outliers. All species have more plots with a count of zero and have a clear non-normal distribution (Fig 7). A Shapiro-Wilk test was done on the seedling abundance data including all species to test the overall seedling abundance distribution. The p-value was well below 0.001, confirming a non-normal distribution.
Where are all the seeds in the soil profile?
|
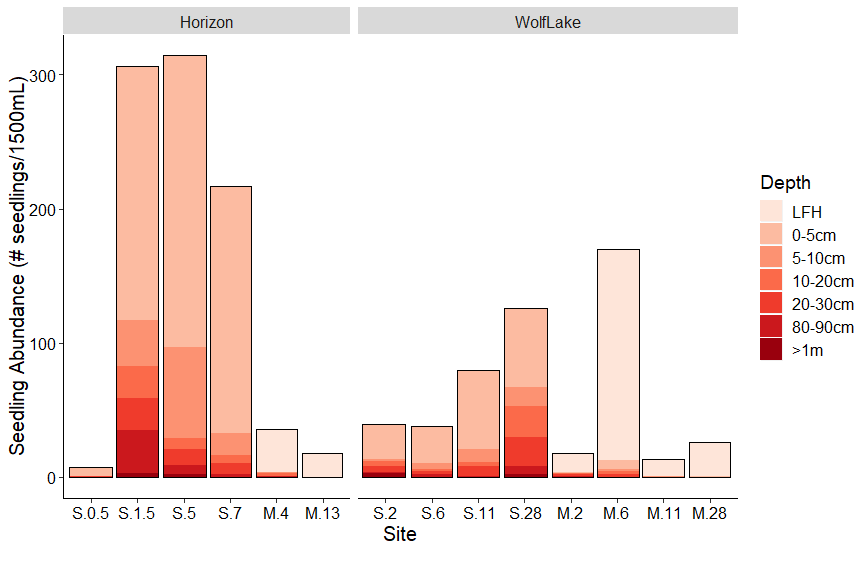
Fig 8. Total seedling abundance by stockpile (S) and natural site/control (M), separated by sampling location. Different colors represent different depth treatments.
|
Figure 8 was created to investigate the impact of age on total seedling abundance per stockpile. Total seedling abundance was chosen so that the land manager could have a better idea of viable seeds numbers. The trend appeared to be different by site, with Wolf Lake seedling abundance increasing by stockpile age. At Horizon, the youngest stockpile (0.5 years old) had a low total seedling abundance, and the seedling abundance peaked in the 5 year old stockpile and then decreased in the oldest stockpile at Horizon (7 years old). There did not appear to be a clear overall impact of age on seedling abundance.

|
Fig 9. Seedling abundance across all stockpile and natural forest sites. All natural forest sites are denoted with an "M". Different colours represent the 10 most abundant species. Other includes all other species summed together.
|
Figure 9 was used to shed light on which sites had a similar seedling abundance and species assemblage to help decide which sites could be combined in Figures 13 and 14. For the Horizon site and Wolf Lake site, many of the natural forest communities were combined because they had a low seedling abundance, and were mostly made up of the "other" category. At Wolf Lake the 2 and 6 year old stockpile were also combined. The 11 year old stockpile was not included in this because of the difference in age. Overall, natural sites had more of the native species (Fragaria virginiana and Viola renifolia), and the stockpile sites included more of the weedy species (Crepis sp. and Trifolium hybridum). Species composition appears to be similar depending on the site (Horizon vs Wolf Lake). Also, there appear to be more non-native species (Trifolium hybridum and Crepis sp.) in the older stockpiles at both sites.
Above ground plant communities
I did a series of NMDS ordinations to look at the above ground and seed bank community data. I chose NMDS ordinations because they allow for non-normal distributions.

|

|
|
Fig 10. 3D NMDS plotting only stockpile site communities. Color represents site name and stockpile age. Total variance explained by all three axes is 48%.
|
Fig 11. 3D NMDS plotting all above ground site communities (stockpile and natural). Color represents site name and stockpile age. Total variance explained by all 3 axes is 49 %. Vectors represent influence of functional group % cover. Natural forest sites are represented by triangles and stockpile sites by circles.
|
When looking at only stockpile communities, there appear to be 2 groups separated out based on age (Fig 10). One group has the 2 youngest stockpile communities (0.5 and 1.5 years old) and another has some of the older stockpile communities (7, 11 and 28 years old). However, the pattern is not very clear. It should also be noted that sites do not appear to group together based on sampling region.
The 3D NMDS including all sites does not show a pattern in terms of the older stockpile communities being more similar to the natural forest communities (Fig 11). However, the natural communities appear to be more similar to each other, and the stockpile to the stockpile communities, which could indicate a stalling in the succession of the stockpile communities.
Is the above ground vegetation community a good indicator of the seed bank community?
|
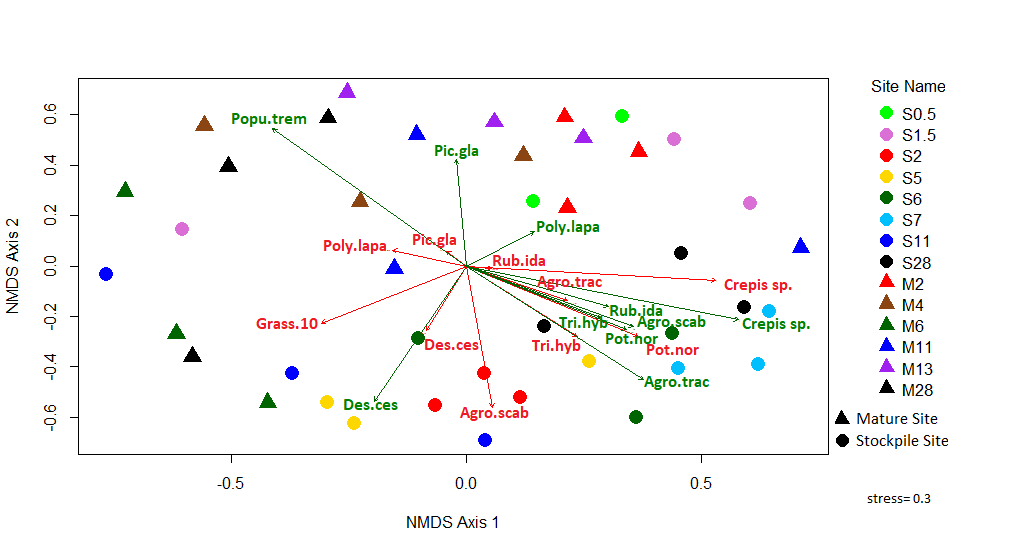
Fig 12. Gradient analysis using a 2D NMDS of the surface seed bank community data. Colors represent site name and stockpile age. Stockpile sites are represented by circles and natural forest sites by triangles. Red vectors represent influence of below ground (seed bank) count proportions and green vectors for above ground cover.
|
Figure 12 was the second figure from the gradient analysis. It was not included in the final results because of the lack of separation between the natural and stockpile sites. It is easier to see which sites include which species when the above ground data is plotted. However, both figures show the same pattern, with most species vectors pointing to the same sites for both above and below ground data, except for the tree species (Populus trembuloides and Picia glauca).
