|
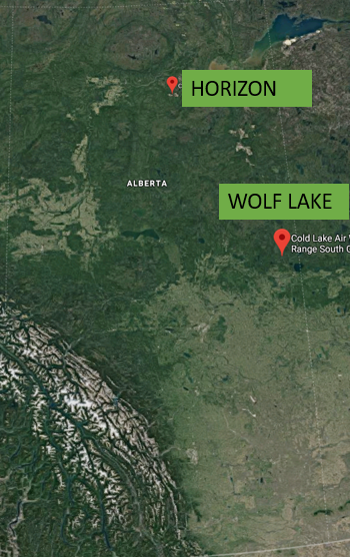
We sampled 4 stockpiles aged 6 months to 7 years old at Horizon, and another 4 stockpiles aged 2 years to more than 28 years old at Wolf Lake. We also sampled 6 natural forest sites that were close to the stockpiles as a comparison. There is a natural site for every stockpile at Wolf Lake (four natural sites) and two natural sites at Horizon (Fig 2). Sites were chosen based on proximity to the stockpile.
|
|

|
Fig 2. Experimental set up. We sampled 8 stockpiles and 6 natural forest sites across 2 sampling locations in Alberta.
|
Seed bank sampling!
|
At each stockpile sampling plot, seed bank samples were taken from five different depths for (0-5 cm, 5-10 cm, 10-20 cm, 20-30 cm and 80-90 cm) (Fig 3) and six different depths for the natural forest sites (LFH, 0-5 cm, 5-10 cm, 10-20 cm, 20-30 cm and 80-90 cm). Two 500 mL samples of soil were collected from all locations and depths and were mixed to get a more representative sample of the seed bank.
|

|

Fig 4. Set up of greenhouse trays.
|
The seedling emergence method was used to estimate the number of viable seeds and the seed bank community for all sites. This method was chosen over identification of seeds because it more accurately estimates which plants can become established in the field (Espeland et al. 2010). Before being placed in the greenhouse, sub-samples were mixed thoroughly and sieved to remove any large debris. Seed bank samples were then spread over potting mix in greenhouse flats and allowed to germinate for 4 months (Fig 4, Fig 5). Seeds that germinated were identified to species level and recorded.
|

|
Fig 5. Greenhouse setup.
|
Above ground sampling!
|
The surface vegetation was also sampled at each plot (8 stockpiles and 6 natural sites x 3 plots= 42 plots). Vegetation plots consisted of four 1m x 1m vegetation quadrats placed in each cardinal direction surrounding plot center. In the vegetation quadrats, percent cover was determined at the species level (Fig 6). The soil pits were dug at plot center after vegetation sampling occurred.
|

|
Statistical Analysis
All statistical analysis was done using R (version 3.4.0). PermANOVA's were used to compare seed bank seedling counts between sampling region and depth treatments. Seedling counts were subset by treatment (stockpile vs natural forest) for this analysis due to their difference in sampling depths (LFH). Seedling counts were further compared between depth treatments using pairwise comparisons (tukey's test, α=0.05). PerMANOVA's were performed on both above ground and seed bank functional group data to compare plant communities across sampling regions and treatments (stockpiled vs control).
